

Important Note: This article is an extended article. This means the article is longer than our typical articles.
INTRODUCTION
In Bahrain and the GCC, it’s not a secret that motor vehicles have become the most predominant form of transportation domestically. Motor vehicles are reliable and a convenient form of transportation for Bahrainis and Expatriates. With multiple options, today ranging from sedans to SUVs, compared to the expatriate and Bahraini a century or so ago, the current population of Bahrain more or less are utilizing what would be considered luxury goods then. However, we should ask, at what cost does the rise of these goods have towards the economy? This is what we will explore in our article.
In the first section, we will look at the rise of motor vehicles. Second, we will look at the impacts that motor vehicles have. Last, we then conclude what potential policies we can put into correcting the current rise of motor vehicles.
The Rise of Motor Vehicles
To say that personal motor vehicles are the primary method of transportation for the island's population is an understatement. Currently, Bahrain has a total registered number of vehicles at 730,000, of which 574,000 are for personal use (78%). Over the past 36 years, we've seen that the total number of private vehicles per hundred individuals has grown from 18 to 34 (figure 1 below).
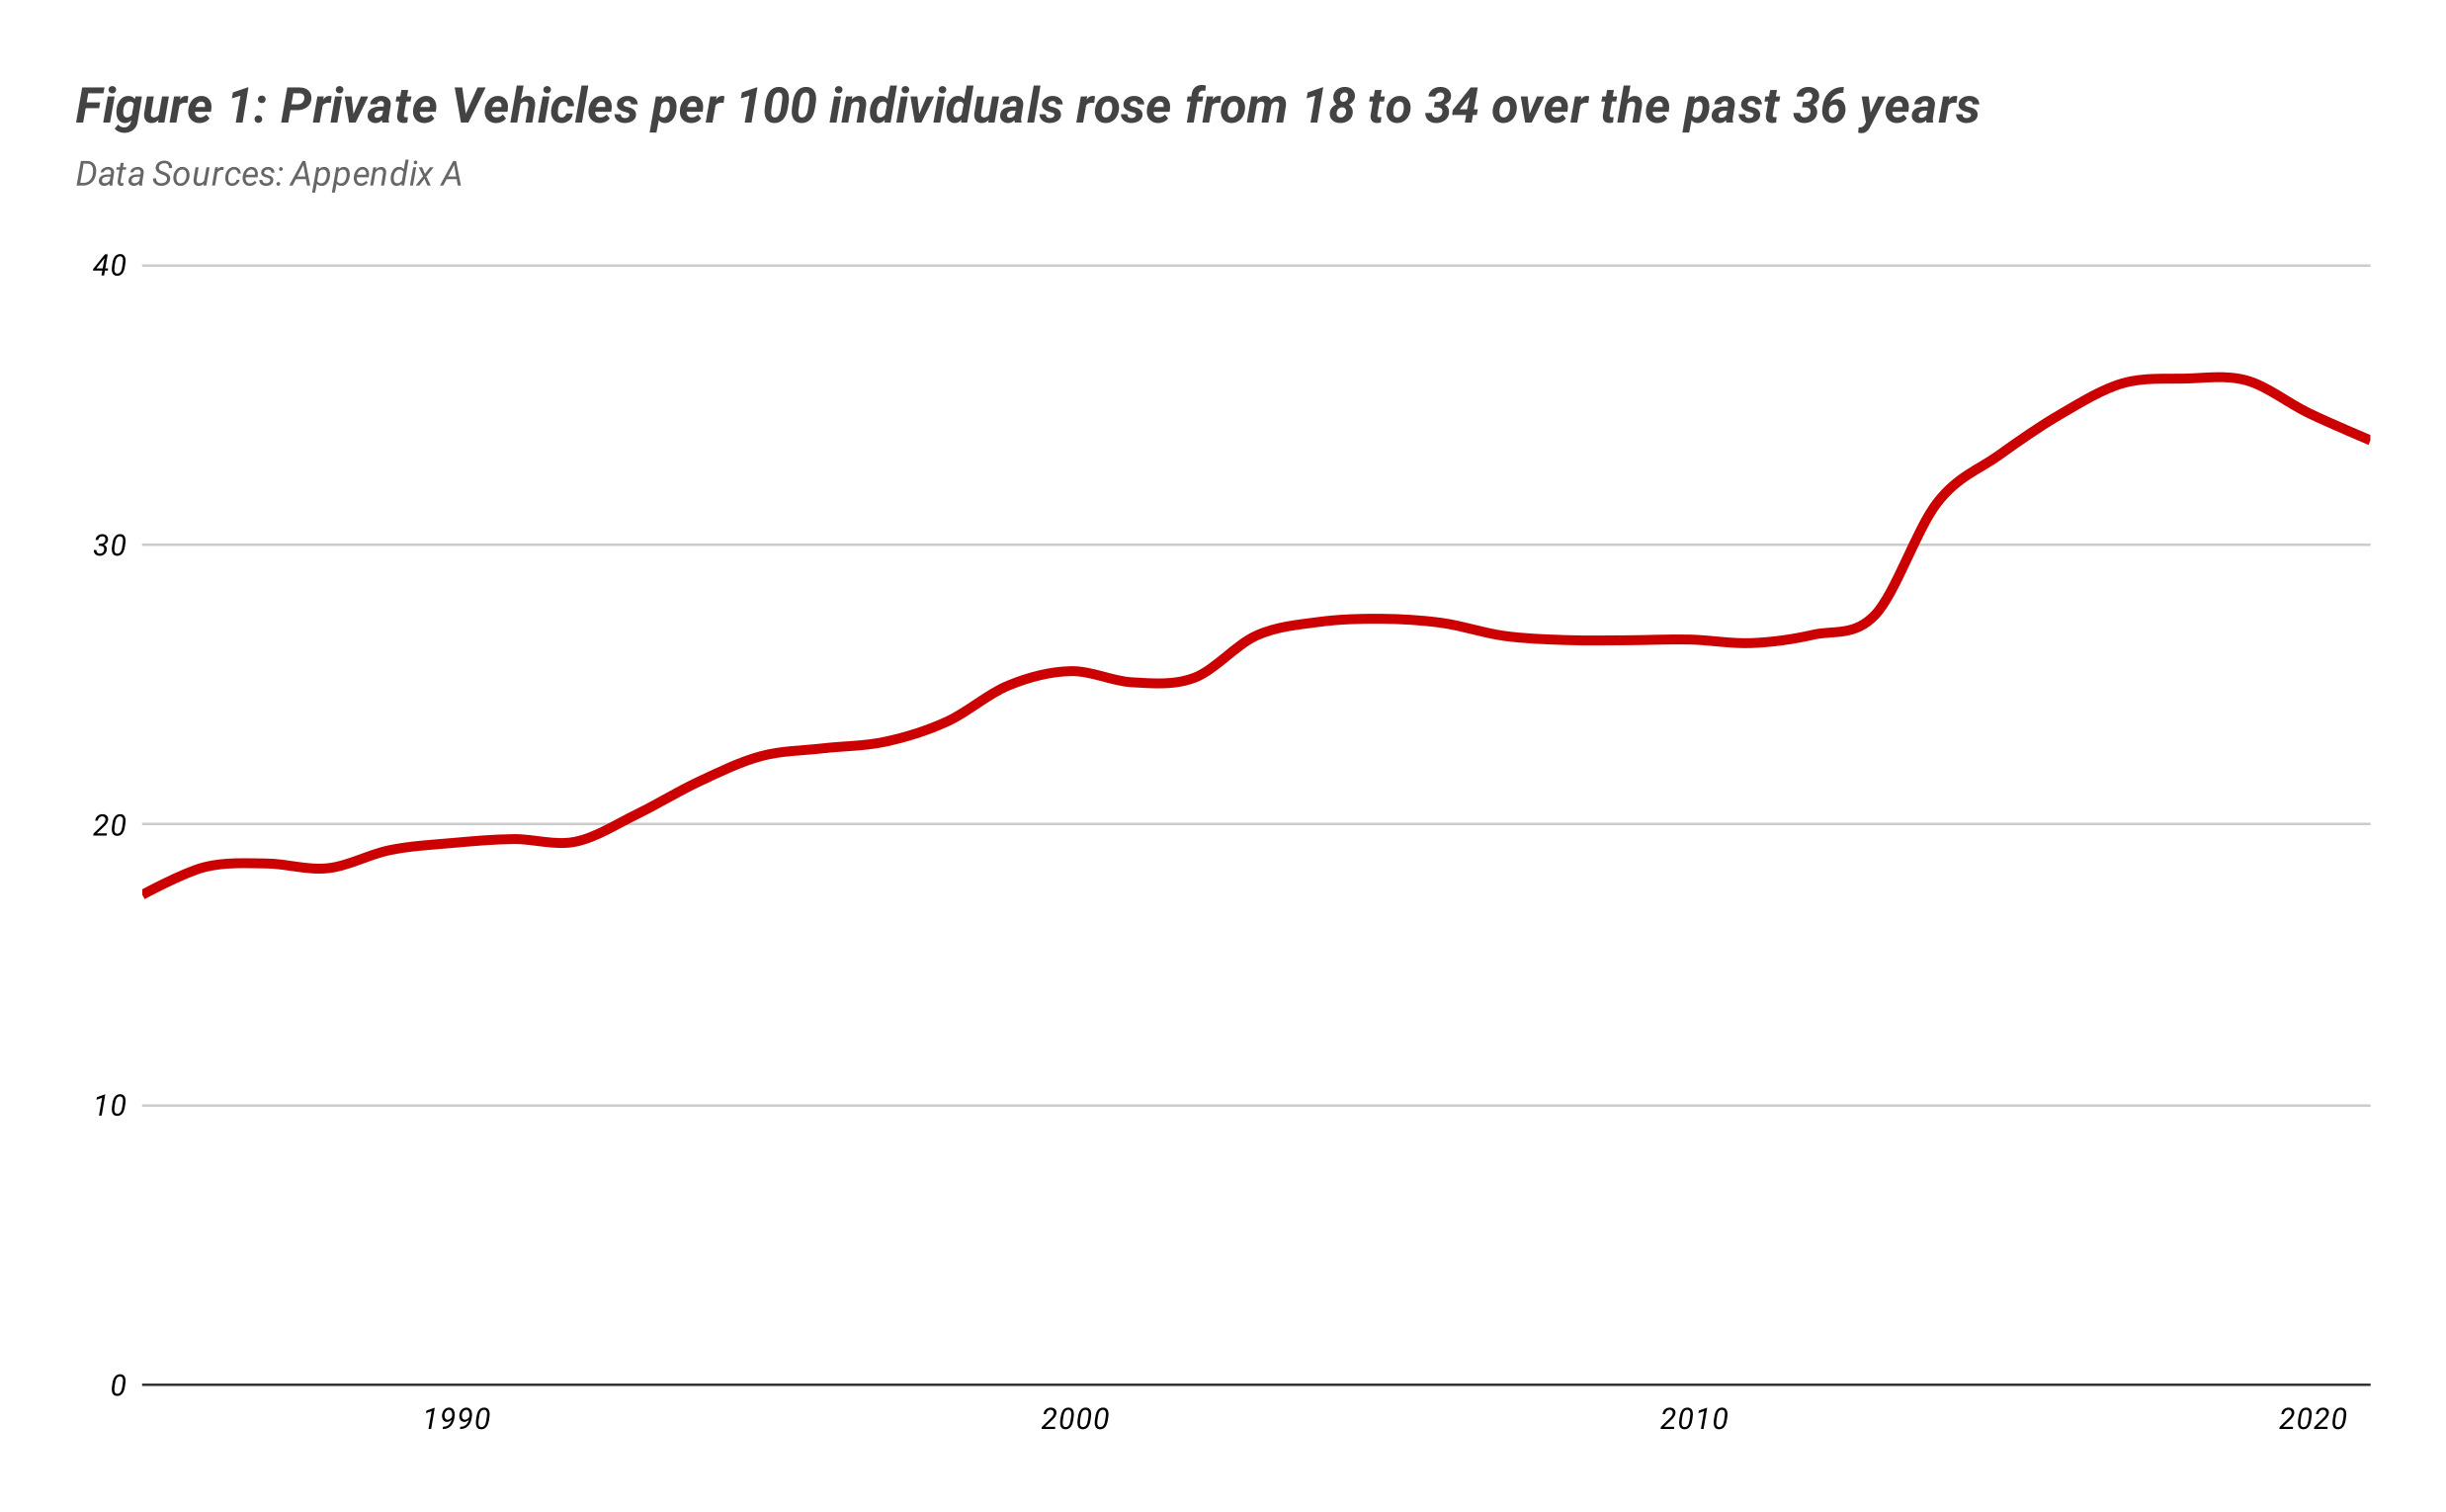
In Figure 1, the growth of total private vehicles per hundred individuals accelerated in particular, post-2010, whereas throughout the 2000 to 2010 period, we’ve seen that this figure had remained more or less flat. This is further supported by the fact that the total number of private vehicles had a weighted accumulated growth rate of 554% compared to all other vehicles of 105% over the past 36 years.
The question arises, what is the potential main driver towards the accelerated growth in both absolute private vehicle numbers and per hundred individuals? In general, one can argue that private vehicles can be regarded as “luxury goods.” Thus, with any luxury goods, with a rise in income, we would expect to see a rise in consumption of such goods, where individuals would substitute their consumption of “normal goods.” Thus, overall, we see a relationship between average income and private vehicles per one hundred individuals (figure 2)
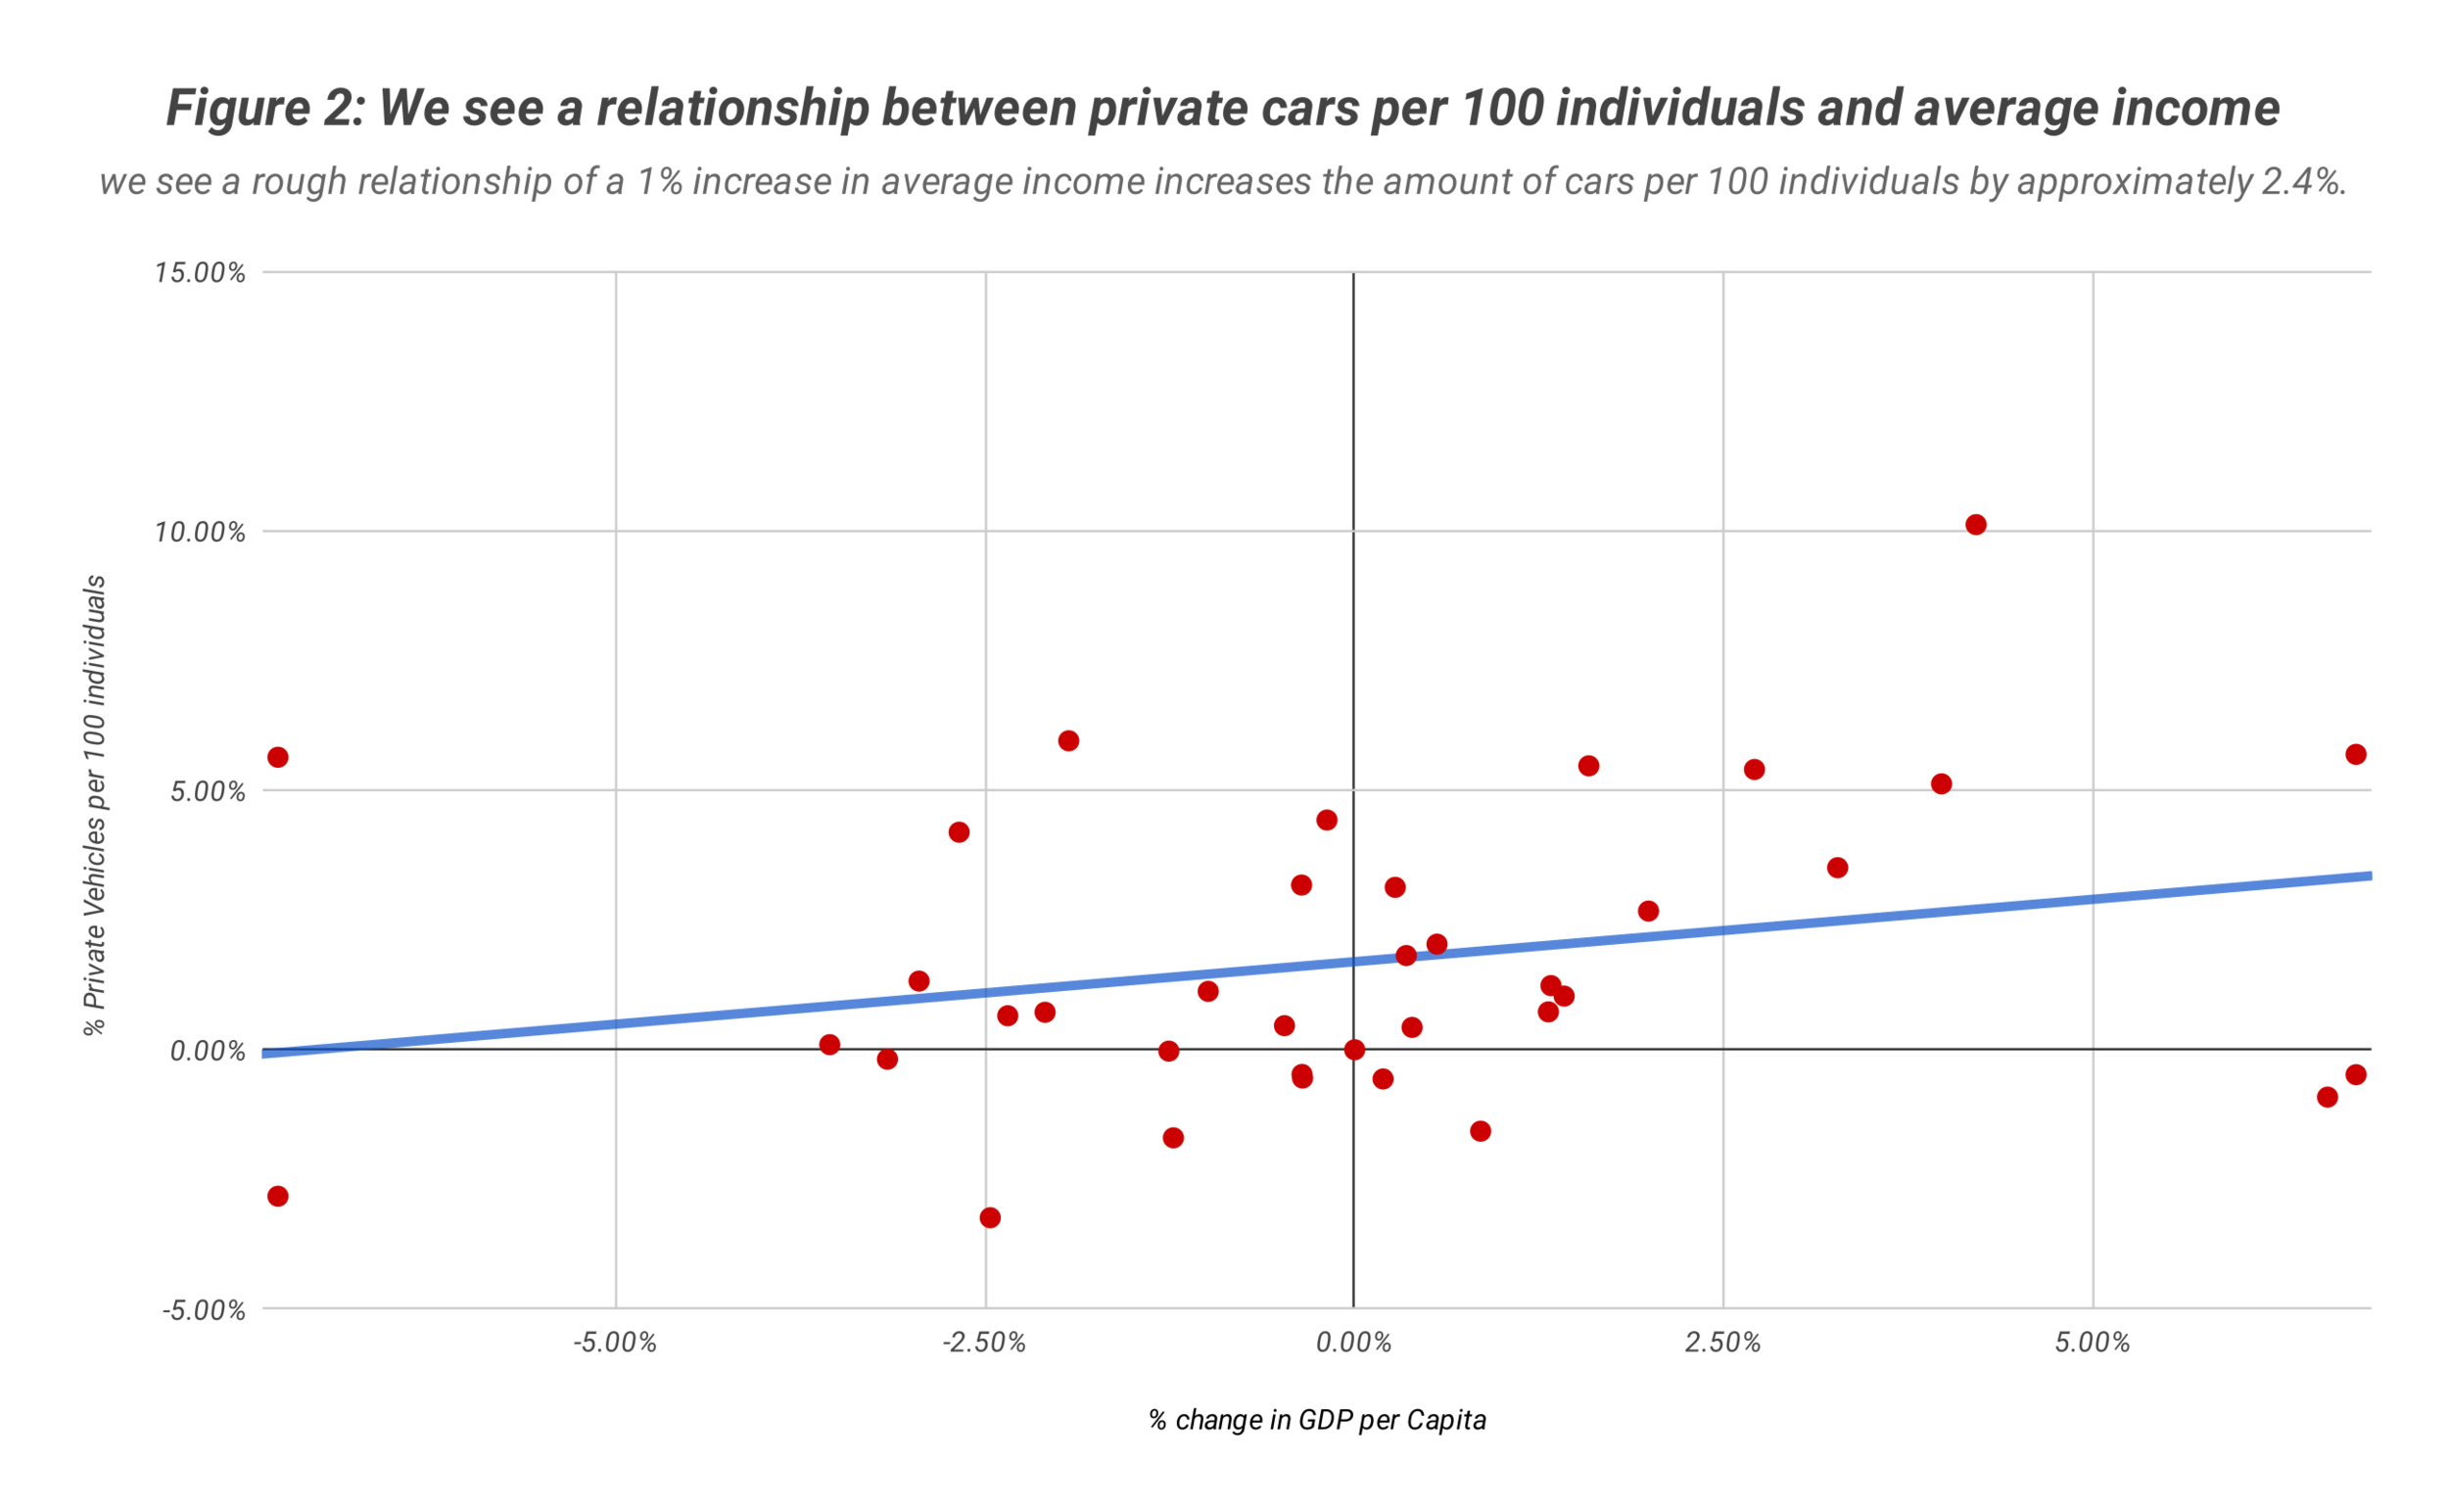
In Figure 2, we see that roughly a 1% increase in real GDP per capita increases the number of private vehicles per hundred individuals by 2.40%. Note that we say “roughly,” given that there are two issues interpreting these results. First, we assume each individual in Bahrain would have access to a vehicle (for example, individuals under 18) and second there are more sophisticated methods which would be used to estimate a more accurate relationship.
What can we learn from the data points above? We see that there has been a rise in the total number of private vehicles. This, in turn, amounts to a scenario in which we see private vehicles per hundred individuals nearly doubling over the past 34 years. The reason for this could largely be attributed to rising incomes, which allow the general population to consume such luxury goods. The question remains, at what cost does the rise of motor vehicles have towards the Economy? We explore this in the next section below.
Understanding what we mean by “costs towards the economy”
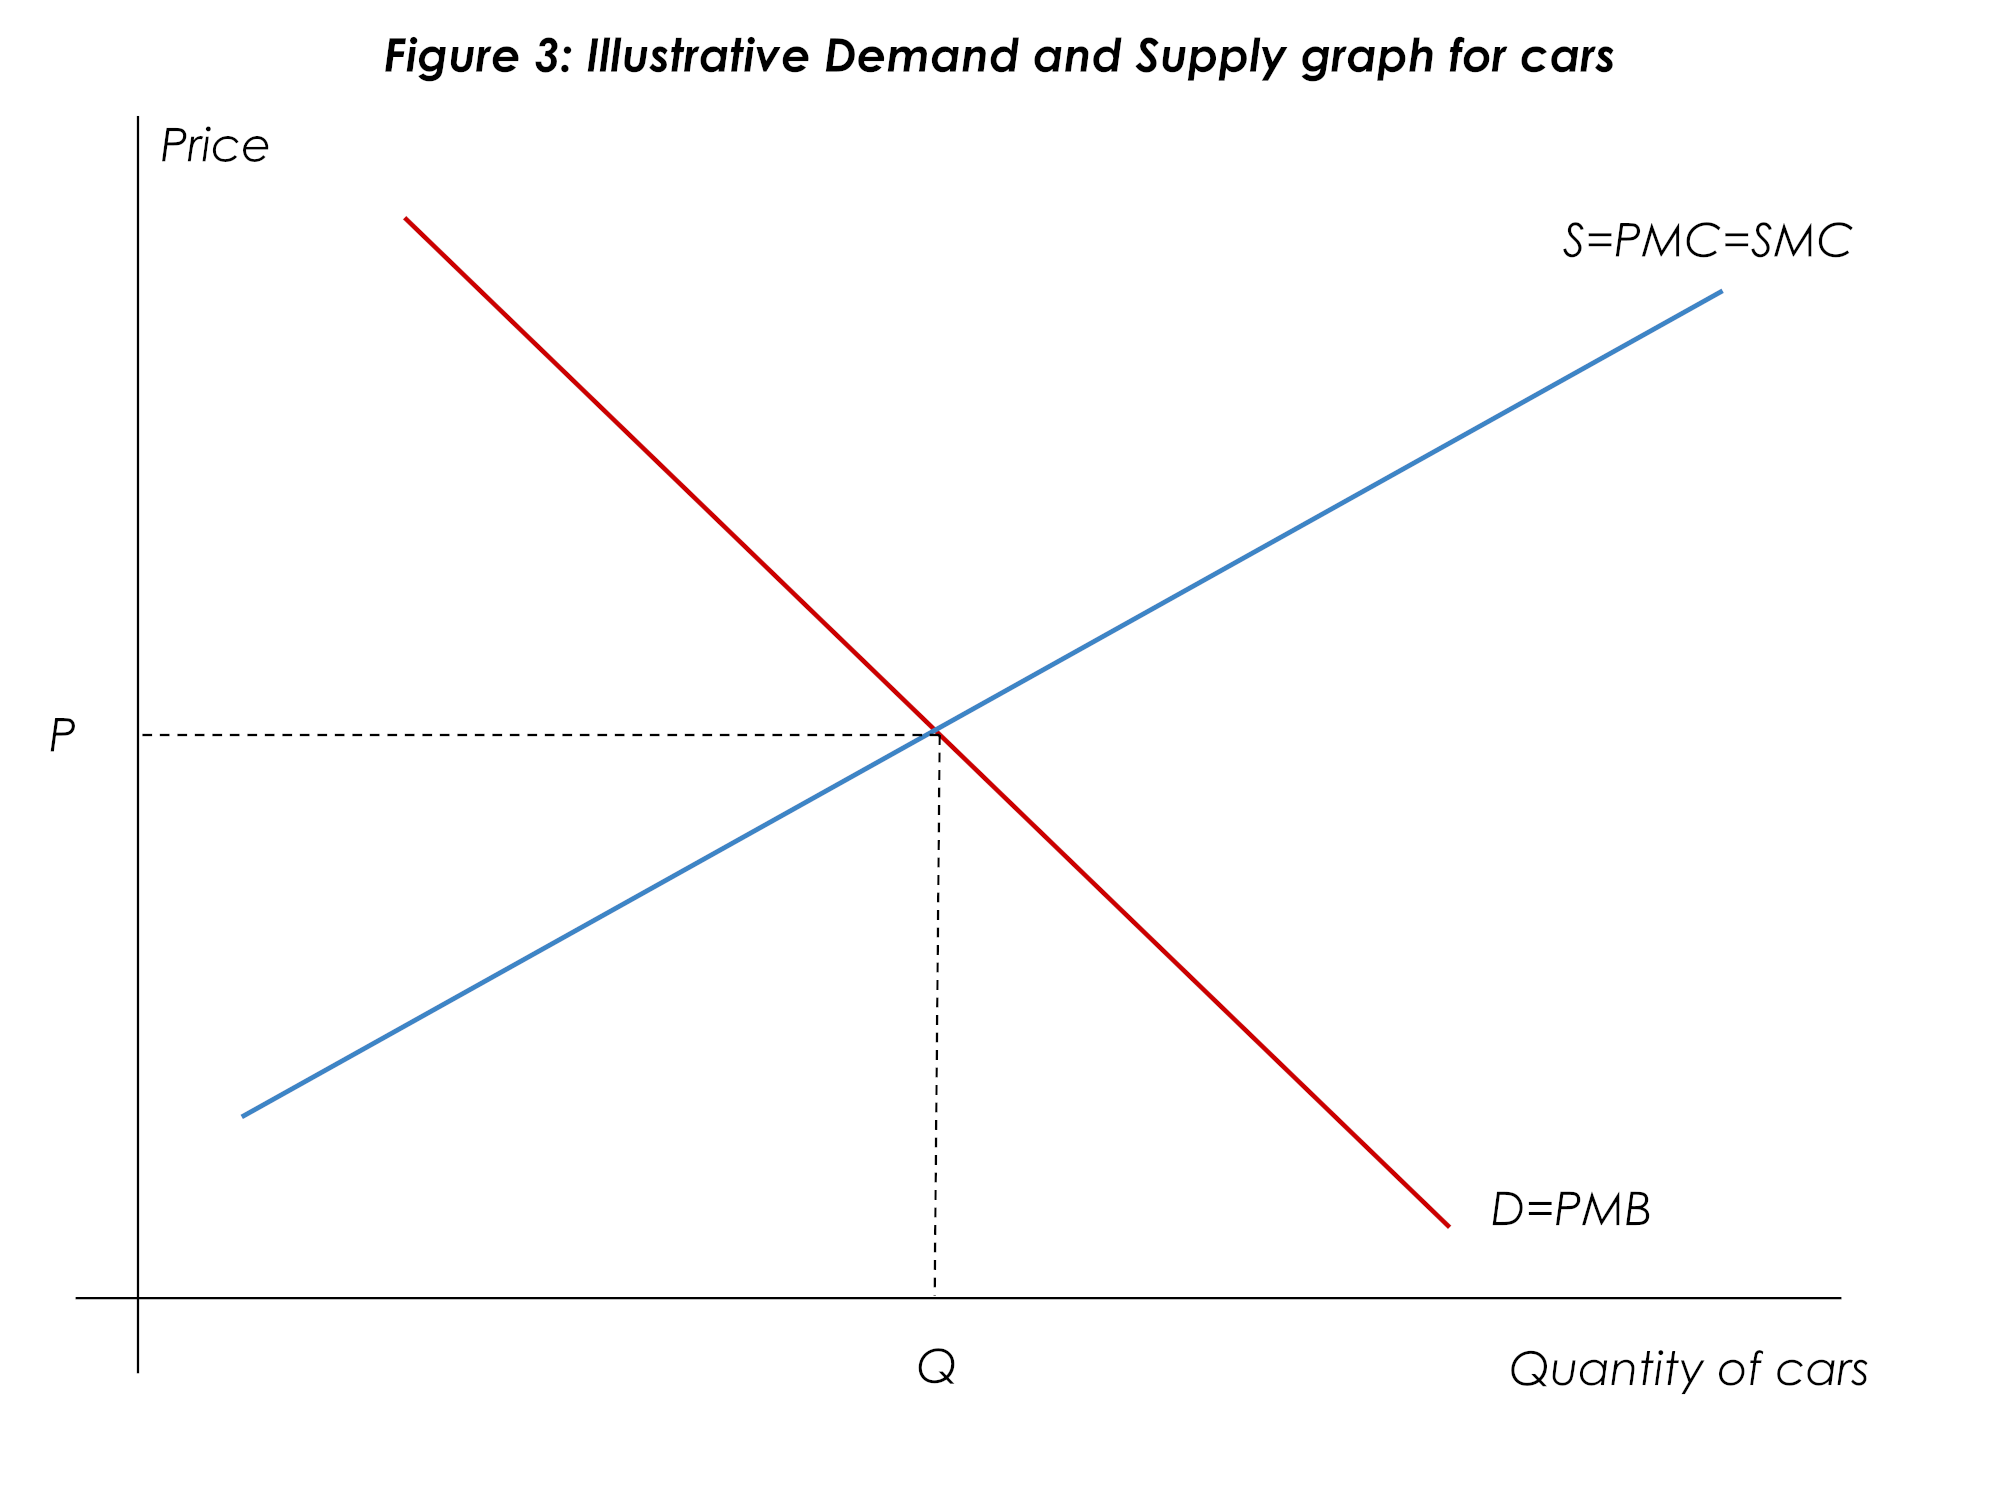
To understand what costs are associated with vehicle use, we must first understand what we mean by "hidden costs." Whenever we purchase a good or service, we expect to derive some benefit from its utilization. Therefore, individuals would purchase a motor vehicle to derive some benefit. It would allow them to travel towards their desired destination in a relatively short amount of time compared to past generations that utilized other means of transportation (on foot, horses, etc.). Therefore, we can say that an individual's demand for a good is derived from the marginal benefit they would obtain from consuming a good. A consumer would therefore consume a certain number of vehicles where marginal benefits equal marginal costs (represented in figure 3 below).
However, while using a personal vehicle derives personal marginal benefits (labeled as PMB), there are also hidden costs associated with using it. These hidden costs are often referred to as "negative externalities." An example of this is that motor vehicles emit Carbon Dioxide into the atmosphere, which in turn contributes to environmental damages via climate change. Thus, the social benefits derived from society's usage of motor vehicles are less than that of an individual, given that society as a whole is affected by climate change in a negative way. This is represented below in figure 4.
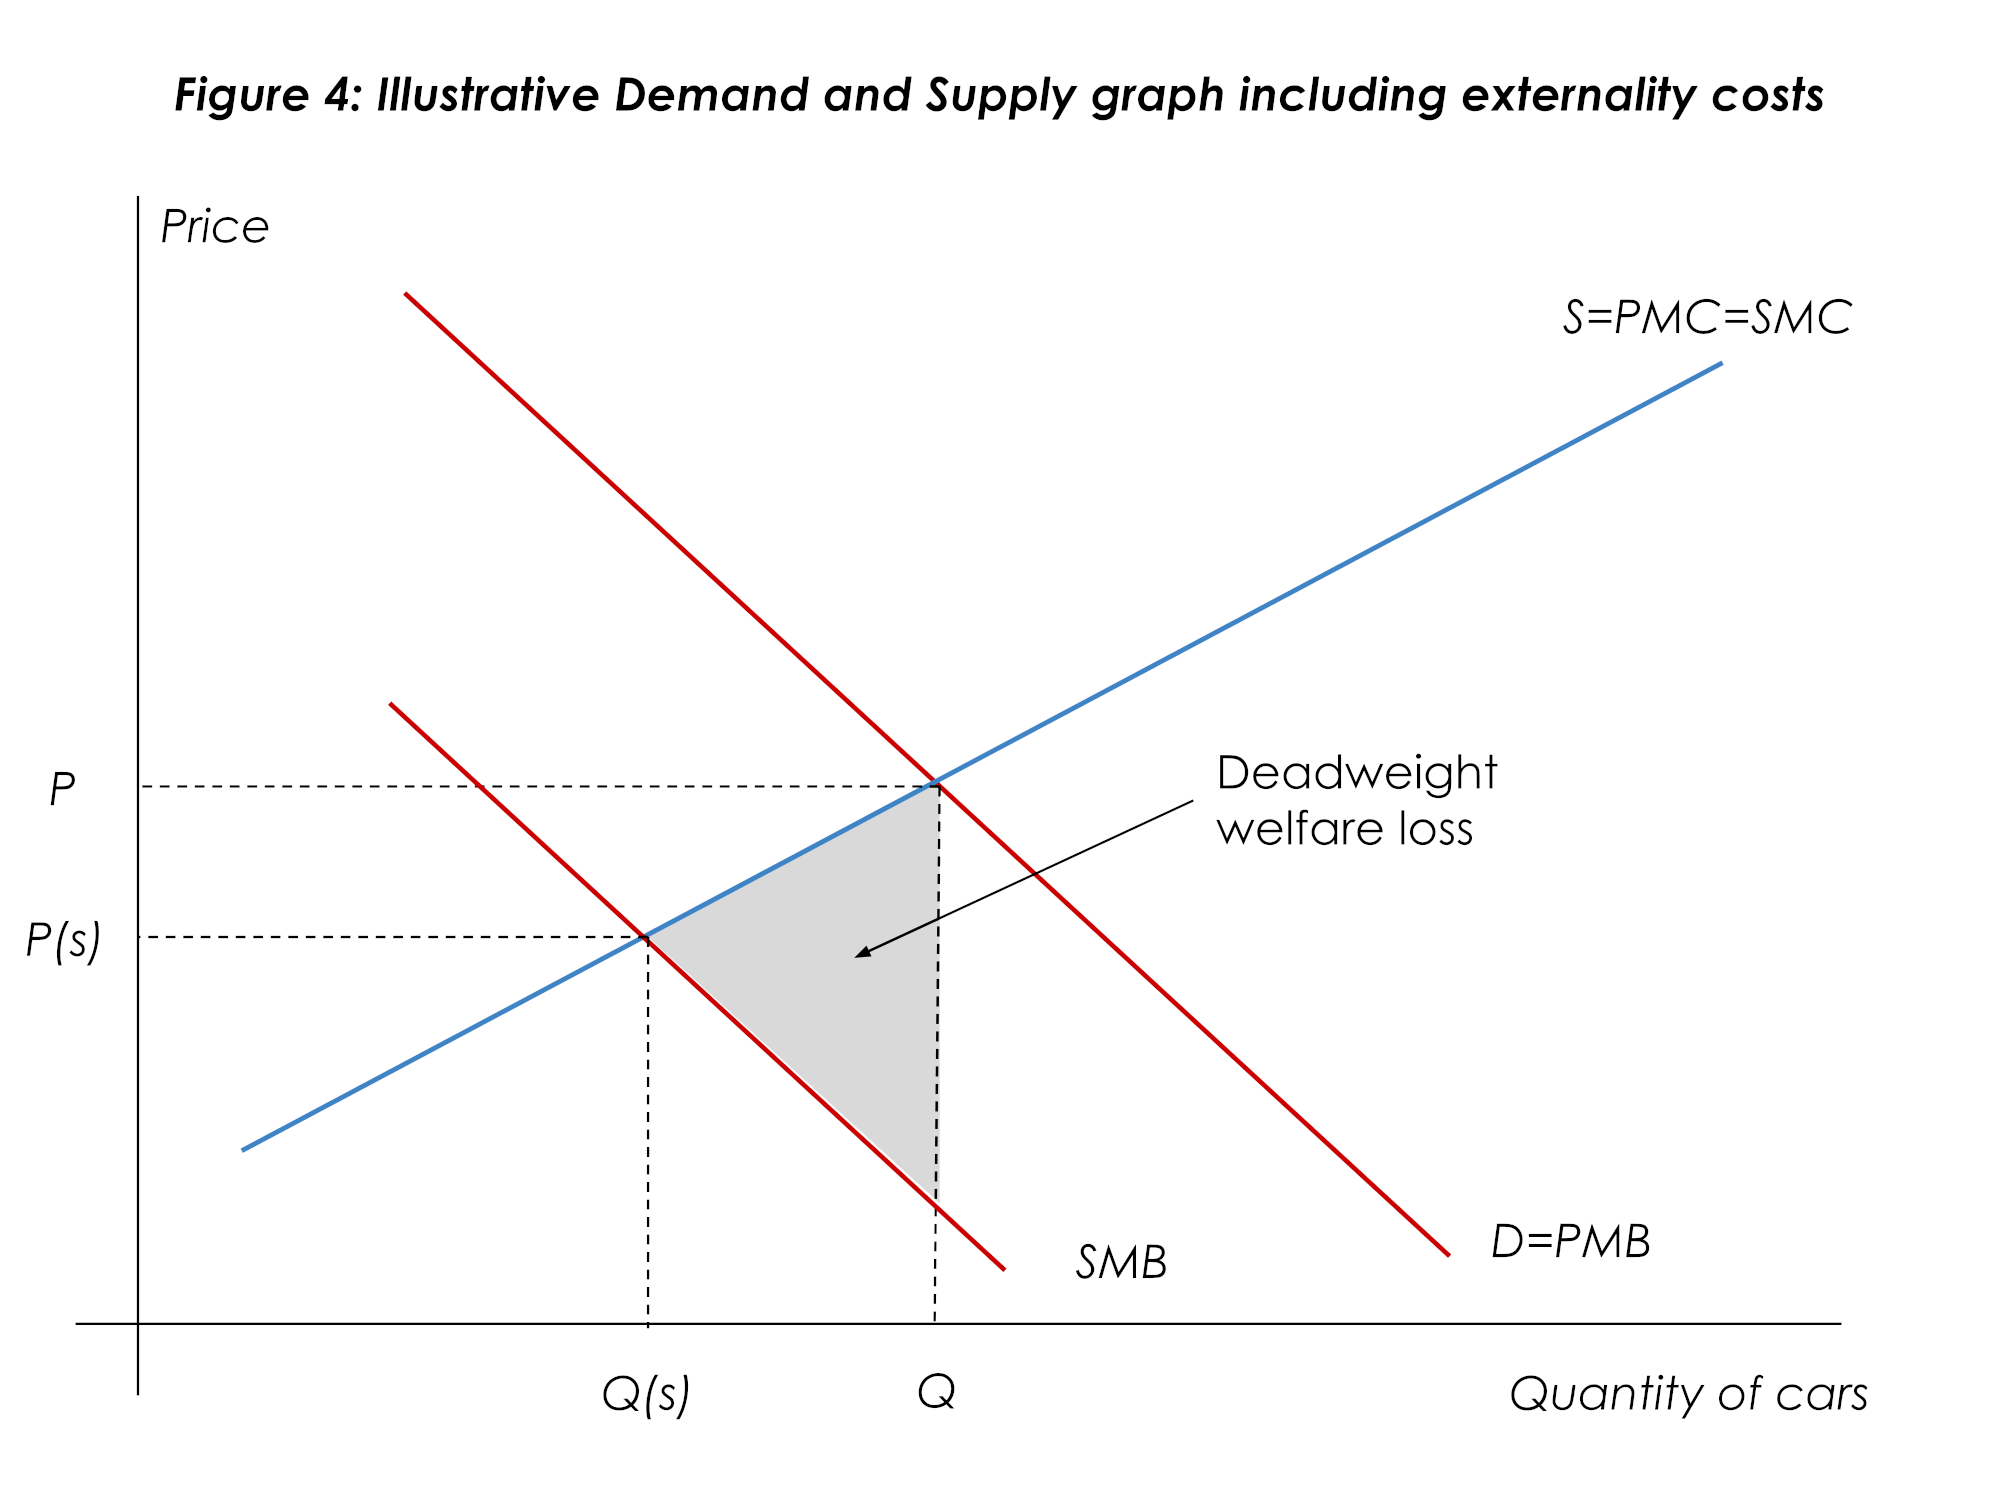
We see that the Social Marginal Benefit (denoted as SMB) is lower than the PMB. Overall, the situation which is created is that a deadweight welfare loss arises. The deadweight welfare loss represents the economic cost associated with the inefficiencies of overconsumption of vehicles. Before discussing how to solve this, we need to explore what are the societal costs related to using personal vehicles and the ever-growing numbers on the road in the next section.
Societal costs associated with Motor Vehicle usage
Although there are multiple different societal costs we can discuss, primarily talk about the following: emissions, tailpipe emissions, congestion, and infrastructure costs. First, let’s observe emissions. It makes sense is to plot how much emissions are estimated to be from transportation. Although the IEA emission figures include other forms of transportation (planes and others), this still provides a decent proxy. Below is figure 5 with emissions from transportation as a % of total emissions.
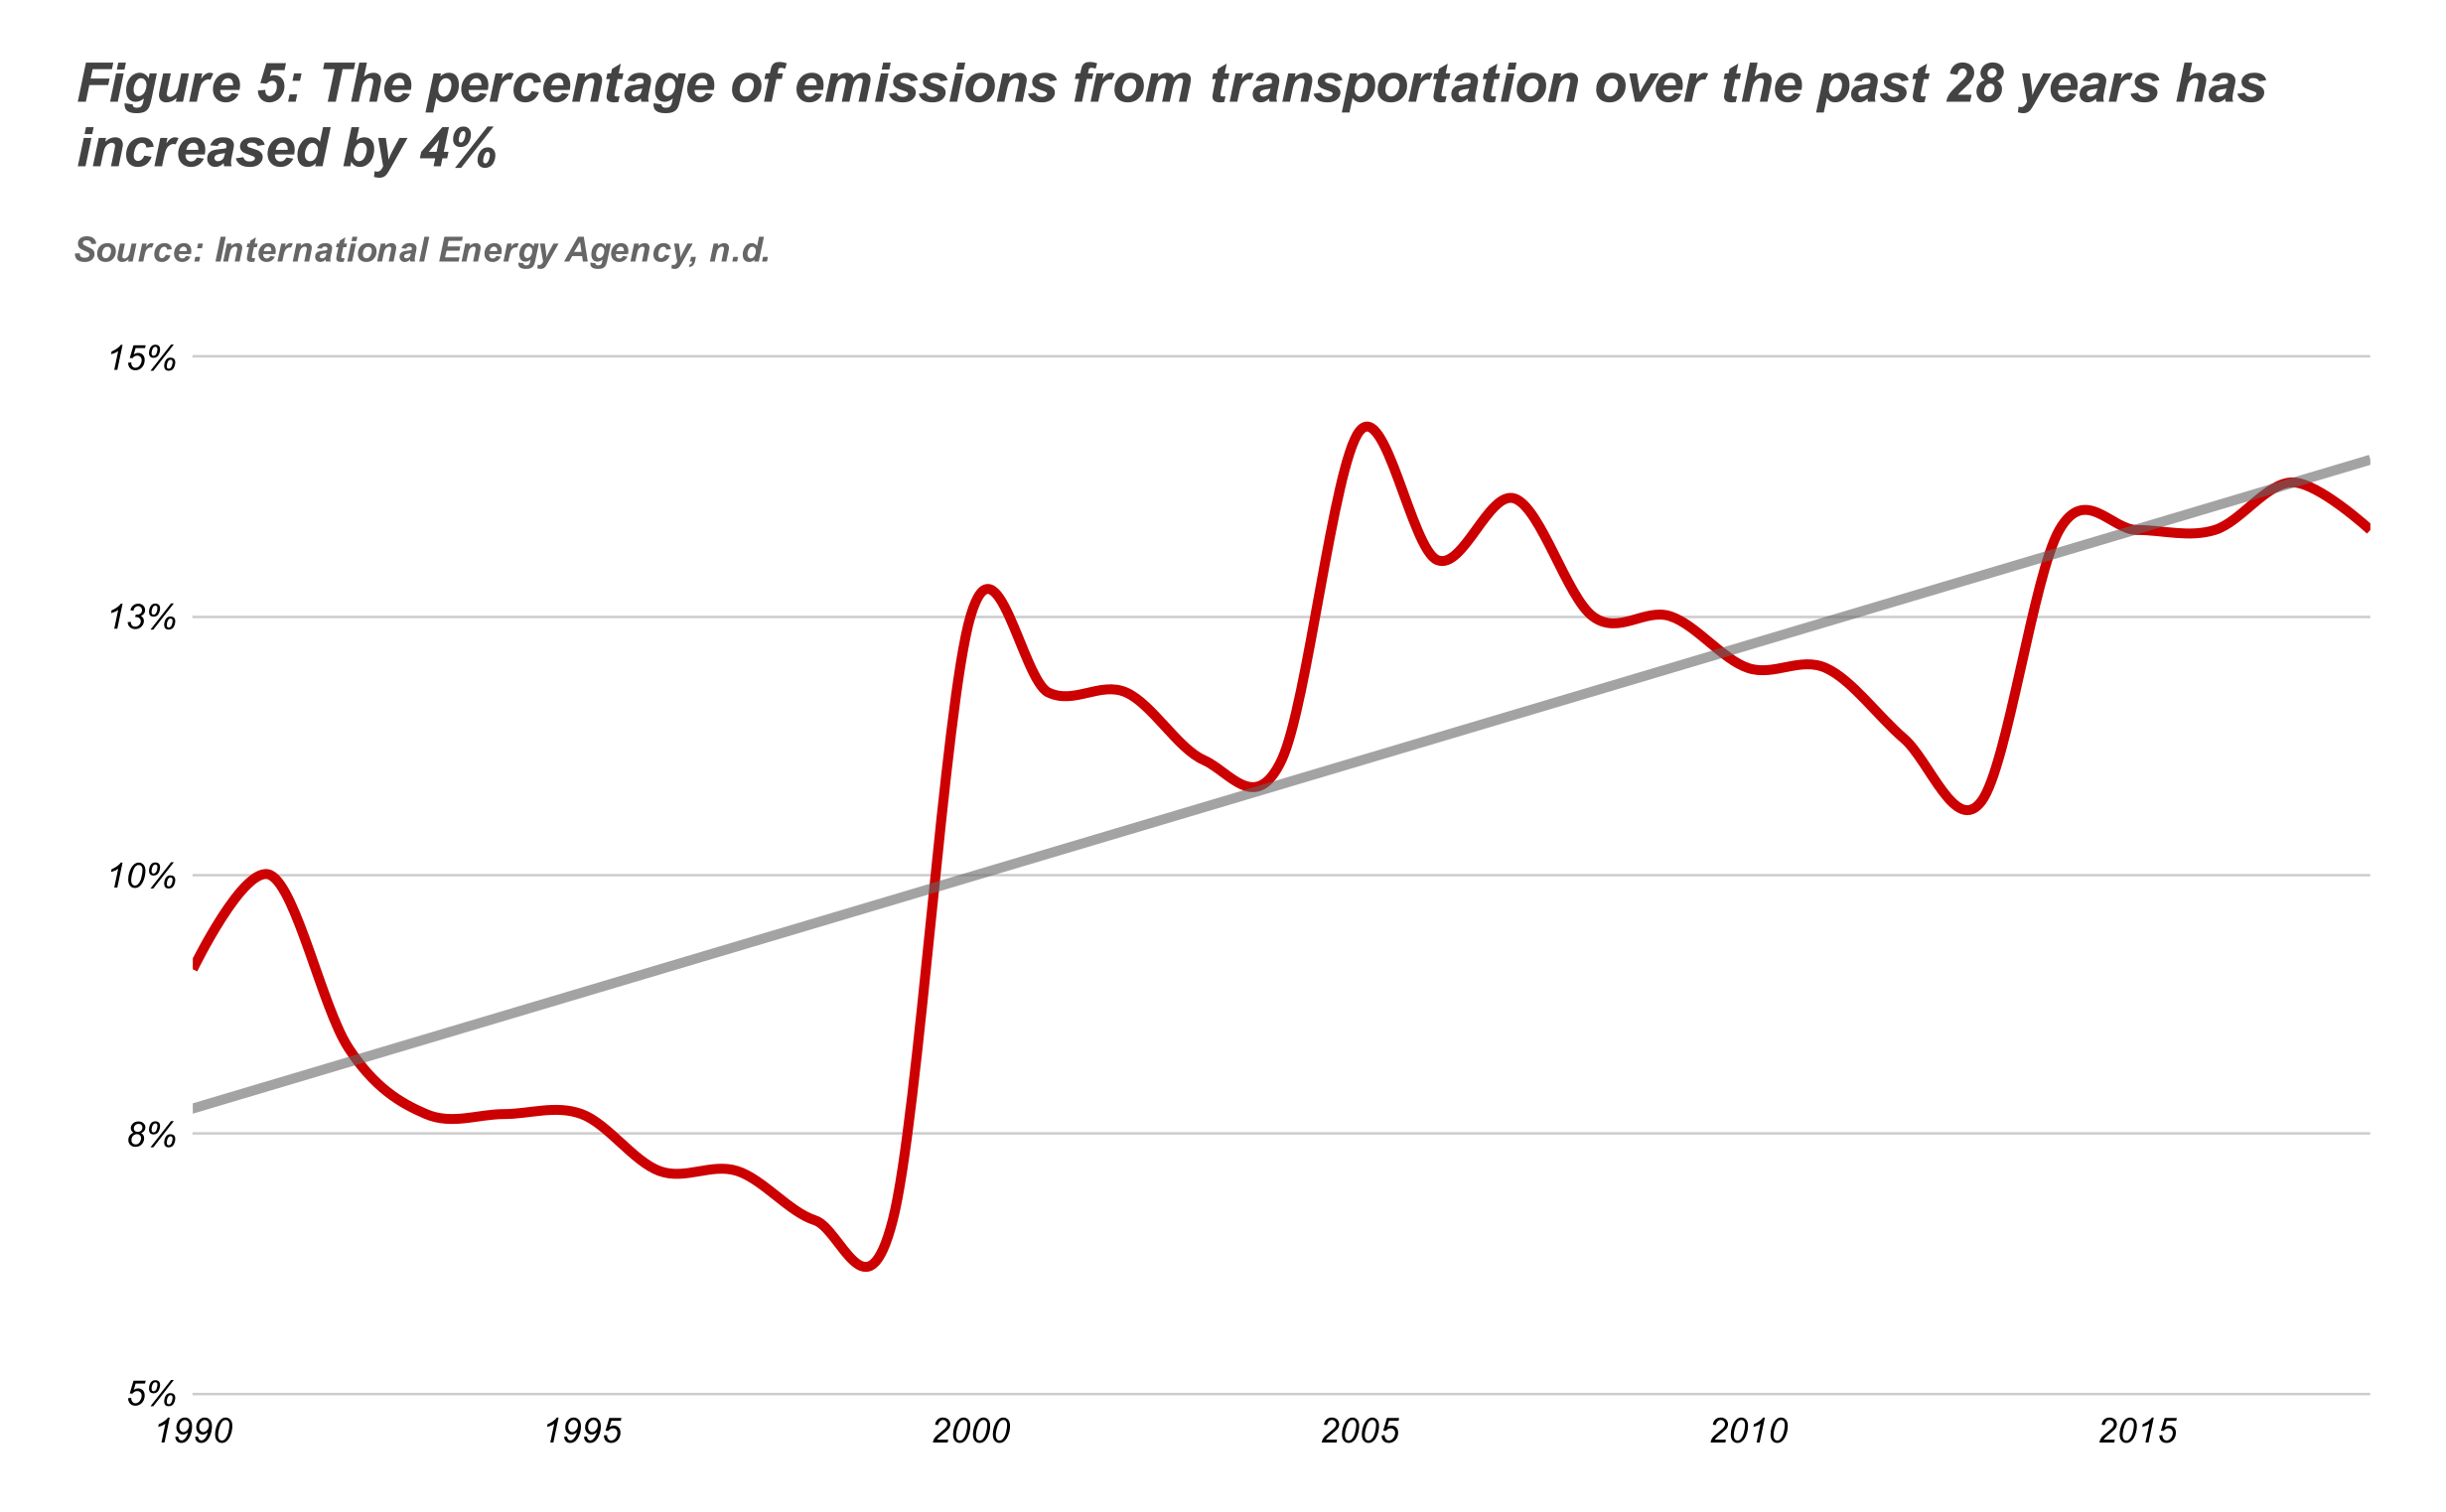
Figure 5 shows that emissions from transportation sources had increased over the past 28 years, representing 9% of all emissions, rising to approximately 14%. This indicates that the introduction of motor vehicles and other forms of transportation and their emissions are increasing further than other forms of emissions (Electricity and heating emissions had increased by 3%, while energy and other industries had decreased by 7%).
An increase in motor vehicles and their usage entails a larger amount of carbon dioxide. This is closely linked to global warming. Increases in carbon dioxide levels are closely linked with activities that utilize fossil fuels (Lindsey, 2020). Globally, emissions must be reduced by nearly 7.6 percent per year to meet the Paris agreement to keep the planet from exceeding 1.5 degrees (united nations, nd). Increases in global temperatures are linked to many environmental damages such as damaged ecosystems and failing food supplies which risk food security.
The second cost is tailpipe emissions. Cars, SUVs, and light-duty trucks emit greenhouse gases and smog-forming pollutants from their tailpipes (epa, nd). These smog-forming emissions are nitrogen oxides, non-methane organic gases, carbon monoxide, particulate matter, and formaldehyde. The dangers of these tailpipe emissions are that smog-forming emissions can make breathing difficult for individuals, leading to asthma, emphysema, and chronic bronchitis (epa, nd). This has significant consequences that motor vehicle smog emissions lead to reduced air quality and thus are associated with premature death.
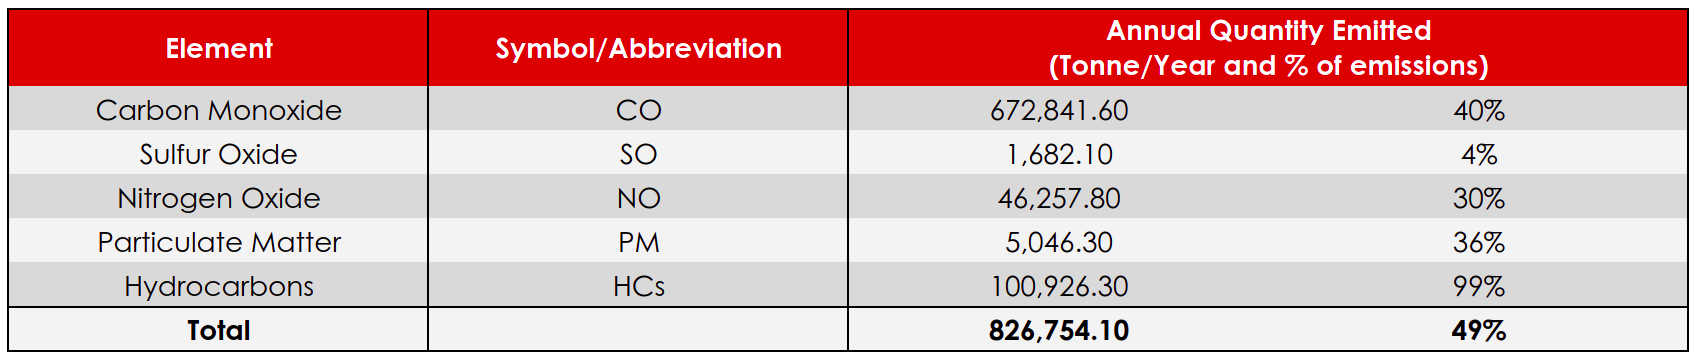
Air quality in the Kingdom was found to be exceeding the monitoring standards (SCE, 2012). Vehicles are the primary source of air pollution in all five governorates. Although dated, research from the Department of Environmental Affairs (predecessors to SCE) in 1997 found that vehicles are responsible for 49% of total air pollutant emissions, as broken down below:
Given that motor vehicles are one of the most significant air pollutants, we can see their effects on Air quality standards. If we use the World Health Organization's guidelines, we see that Bahrain's air quality is considered unsafe (IAMAT, 2020). Although there are natural factors such as sandstorms, most unsafe air quality standards are from industrial pollution, private cars, and fertilizer manufacturing. What is particularly interesting is that there are seasonal variations in air quality, with June and July having higher levels of poor air quality than December and January.
Poor air quality has negative consequences on human health. From the data, approximately air pollution contributes to 9% of deaths in 2017 (Ritchie and Roser, 2017). However, Bahrain currently stands at an estimate of 12.23%, placing it as the 6th highest country with the share of deaths from air pollution. Overall, we see that motor vehicles are a significant contributor to smog and that the usage of such vehicles has significant health consequences and even associated causes with deaths.
We could create a rough estimate to see if roads and highways are becoming more congested when looking at congestion. For example, we could take the total number of vehicles divided by the total length of roads. Although this method does not accurately represent actual congestion, such as using the Volume to Capacity ratio (greenbelt alliance, nd), we can see how fast motor vehicles are growing compared to the total length of roads available. Figure 6 shows our “car per kilometer” metric.

Figure 6 shows that since 1991, the number of vehicles per kilometer of road has increased by nearly 7% per year on average. This reflects the data where total vehicles had grown by almost 16%, while total km of road networks grew on average 3% per year. It appears that post-2015, with the introduction of infrastructure spending, we see that our proxy congestion measurement had fallen, indicating that expansions of road networks were underway (oxford business group, 2018). This is supported by the data where the expansion of total km of road is higher than historical year-on-year growth. However, the growth in the total amount of vehicles was lower than historical year-on-year growth, which may indicate a decline in consumer spending due to changes in Economic conditions combined with increased government spending to act as a fiscal response towards declining economic conditions. Again, it is important to note that this is only a rough estimate, as we do not know the volume to capacity figures.
Finally, when looking at infrastructure spending, there is no unified figure which we can look to represent the amount being spent on road infrastructure. The closest figures are government budgets allocated to the ministry of works, municipalities affairs, and urban planning. However, when looking at the data, it appears that allocated budget as a percentage of the overall budget seems to be declining rather than increasing from 2010 and onwards. This indicates that our proxy is flawed or that other uncaptured factors like foreign direct investments would not be easy to untangle. A potential solution for future studies is to look at working papers by the World Bank which aims to tackle infrastructure spending as a percentage of GDP, which looks at Gross Fixed Capital Formation on civil engineering works, Gross Fixed Capital formation of general governments, private participation in infrastructure, and data from BOOST to measure individual components of infrastructure spending (Fay et al, 2019). However, judging from the data, it’s likely that infrastructure spending for roads in specific would have increased given the recent expansion of road networks relative to historical growth rates.
Implications of the continuous rise of motor vehicles
We see from the trends that motor vehicles have a definite negative impact on the environment, and potentially towards congestion and government budgets to upkeep with ever-increasing amounts of personal vehicles. In turn, it has costs that can be measured and indirectly contributed to the economy. For example, Murphy and Delucchi 1997, finds that multiple papers have found considerable unpriced, non-market, or external costs associated with the use of motor vehicles. However, the degree of costs varies depending on the datasets and methodology used. (Delucchi et al, 1996), they find that total societal costs of highway transportation alone range from 1.9 billion USD to 3.3 billion USD (1991 US Dollars).
Concerning the GCC, specific studies on carbon emission costs (as a whole or solely from transportation), air pollution, congestion, and road work infrastructure is not known to the author. Thus quantifying the total societal costs of these items is difficult, and thus from this point, we will need to generalize. We first start with carbon emissions.
Given that the transportation sector contributes towards carbon emissions, this would negatively impact the region's climate, and thus this would have indirect costs towards society that relies on the need for stable climates. Therefore, continuous increases in motor vehicles and their usage are likely to increase the overall societal costs based on changes in climate conditions. This is imperative given that the GCC is particularly vulnerable to climate change given the geographical location (Smith, nd).
When looking at smog emissions (tailpipe emissions), the largest cost to the economy would be premature death prevention and healthcare costs. As with overall economic costs related to carbon emissions, no specific studies look at overall economic costs related to air pollution. However, the World Economic Forum states that air pollution has an estimated 2.9 trillion US dollars in economic costs, equivalent to approximately 3.3% percent of the world’s GDP (McCarthy, 2020). Therefore, it is likely that given estimates show that deaths from poor air quality in Bahrain is higher than the world average, that economic costs are potentially substantial due to the need for healthcare costs, lower potential participation rates due to chronic health diseases, and loss of life which presents both direct and indirect costs. Therefore, large opportunities costs are likely shown concerning Bahrain and having poor air quality where motor vehicles contribute to the issue.
The final implication is that of congestion and infrastructure spending. With ever-increasing numbers of cars, congestion is likely to increase if there are no changes towards infrastructure spending, thus increasing travel-time across the island. Furthermore, there is also an opportunity cost related to infrastructure spending where such funds can be placed elsewhere to improve economic efficiencies.
What are the implications of the trends above? Many inefficiencies are presented; those are from environmental damages, health-related damages towards individuals and thus the overall economy, and that of opportunity cost related to infrastructure spending and increased travel time. To the best of our knowledge, overall, no precise measurements show these costs in relation to GDP in the GCC or Bahrain. Although the overall costs are likely to be significant.
Policy recommendations to counteract societal costs related to motor vehicle usages.
Ultimately, policy recommendations should come in two different solutions. The first is to reduce the consumption of motor vehicles; the second is to increase the use of alternatives. We begin with the latter. Alternative solutions are those of mass public transportation such as metro lines or buses. Without alternative solutions, those most price-sensitive towards changes in motor vehicle prices require alternatives to commute towards desired destinations. If we look at buses as an example, we see that the share of public-oriented transportation as a % of all vehicles has declined (Figure 7 below).
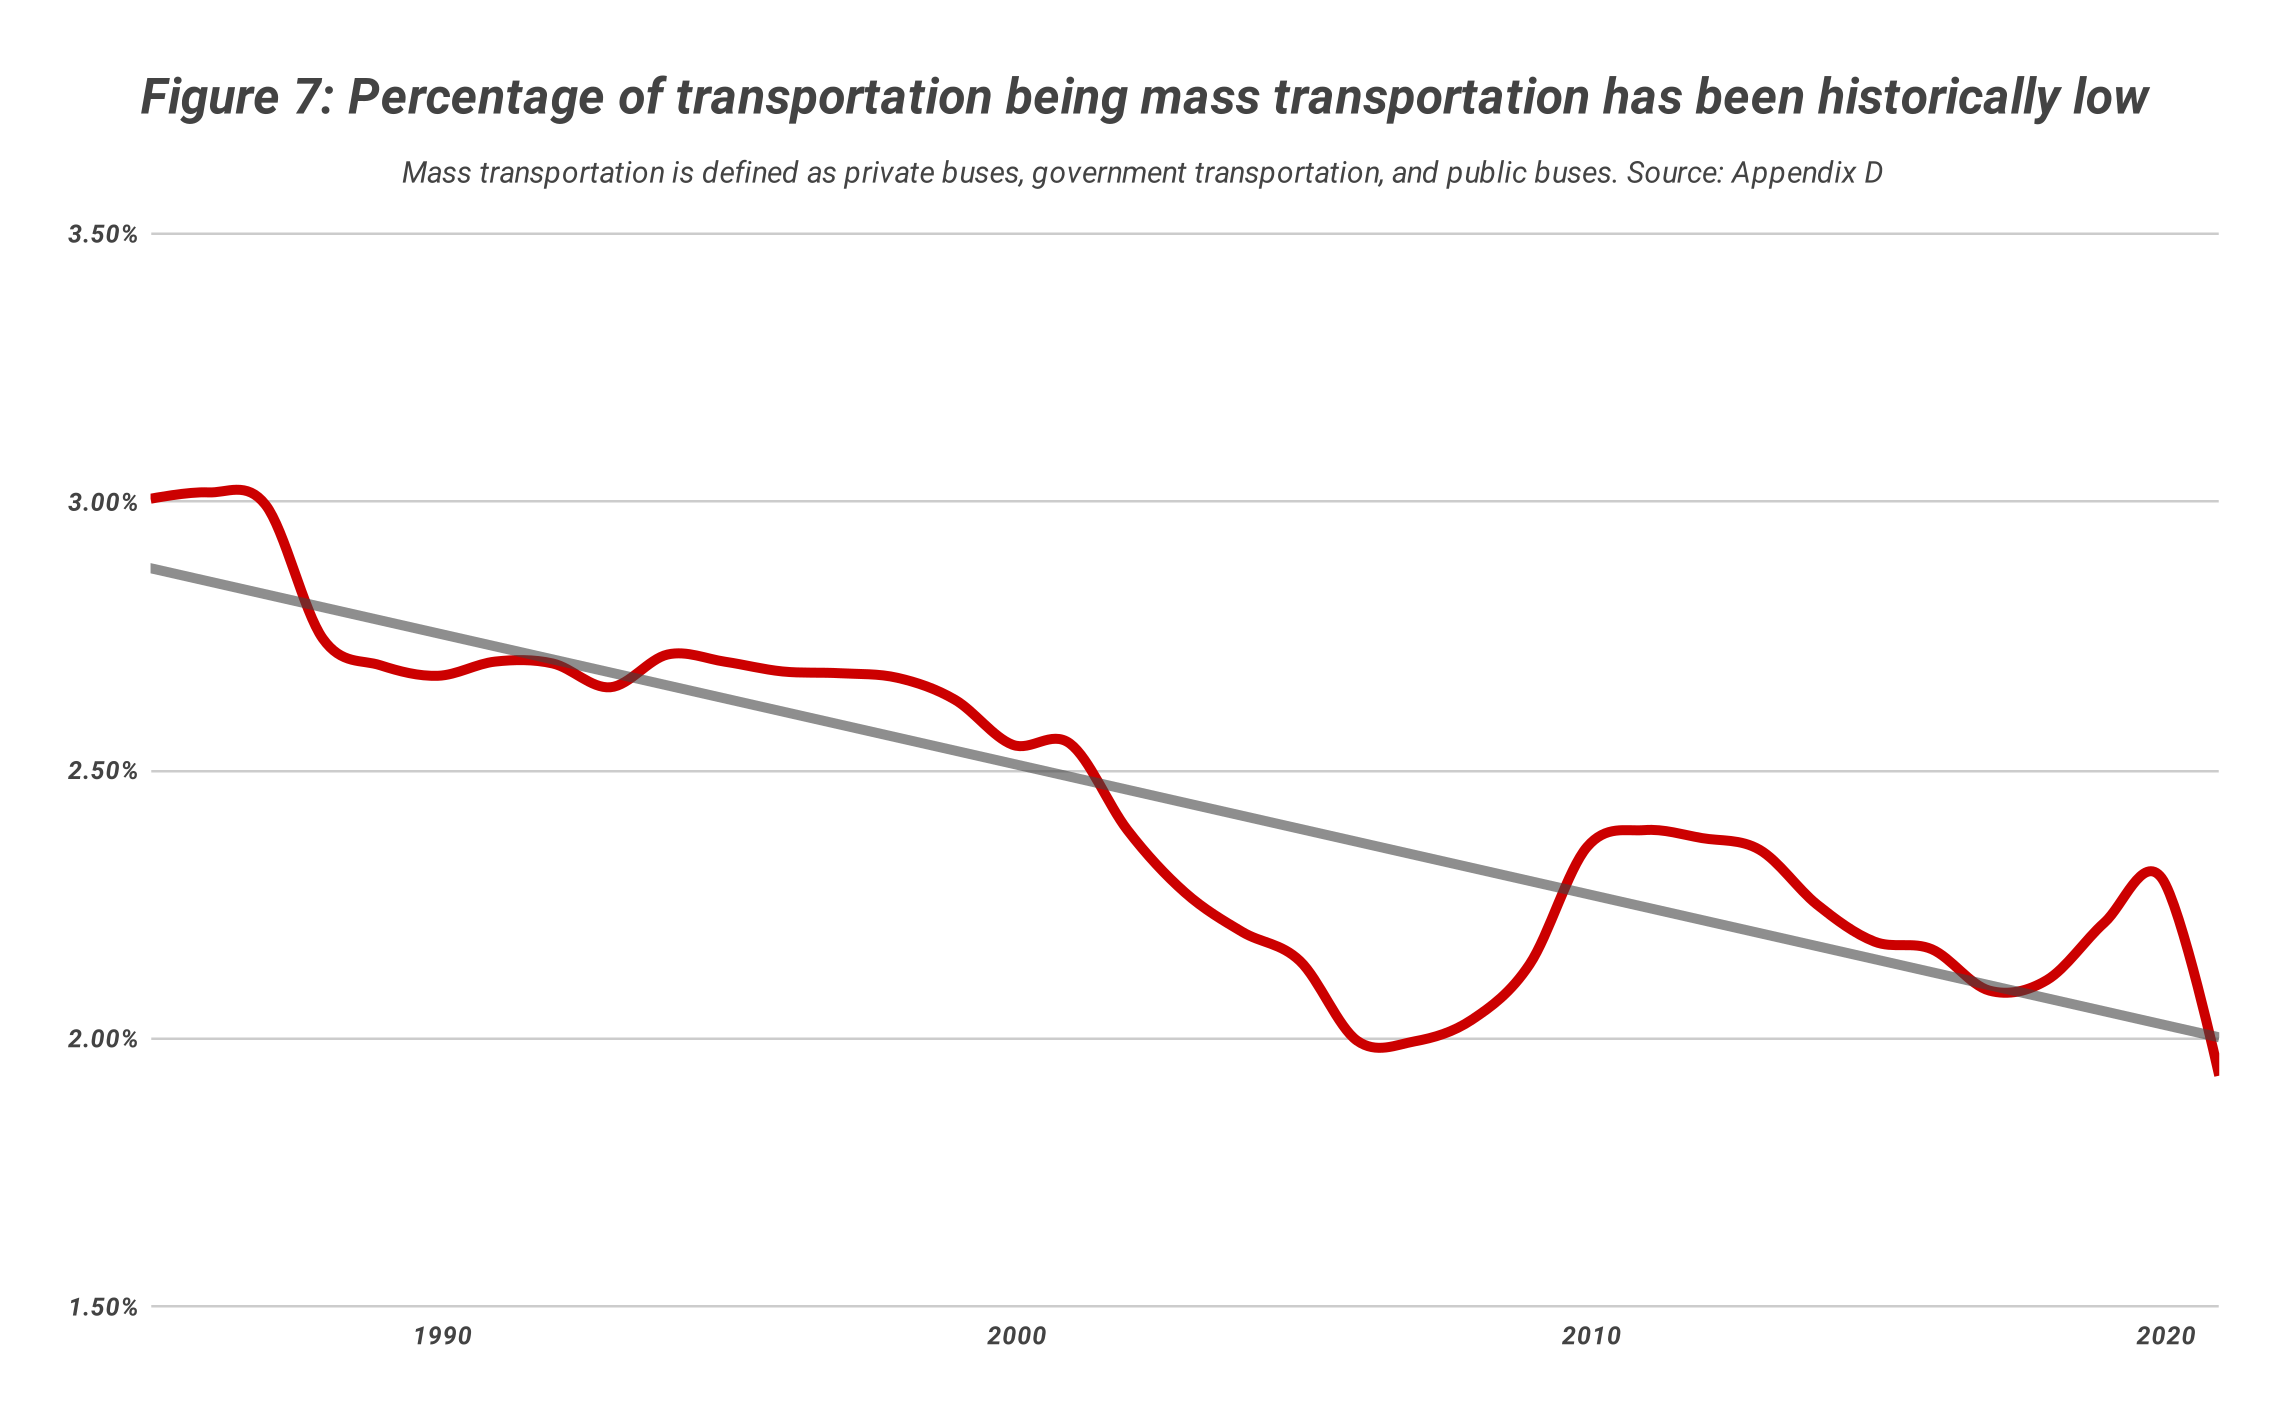
Figure 7 shows that "mass transportation" as a percentage of overall vehicles has declined. However, there are two significant assumptions towards our metric. First, we do not take into consideration the capacity of "mass transportation", meaning that the average capacity may have changed across time (for example, if there are more individuals per bus on average, this means the total amount of individuals traveling on buses as a % of the total amount of individuals traveling may have increased). Second, we assume transportation methods such as "private hire for passengers" are low in capacity and thus should not be considered "mass transportation." Nevertheless, we see a significant decline in the percentage of vehicles considered as "mass transportation." Suppose we are to place fuel or taxes on cars. In that case, the need to expand other forms of mass transportation is imperative, given that without such expansions, this may reduce the amount of travel conducted by individuals in such categories.
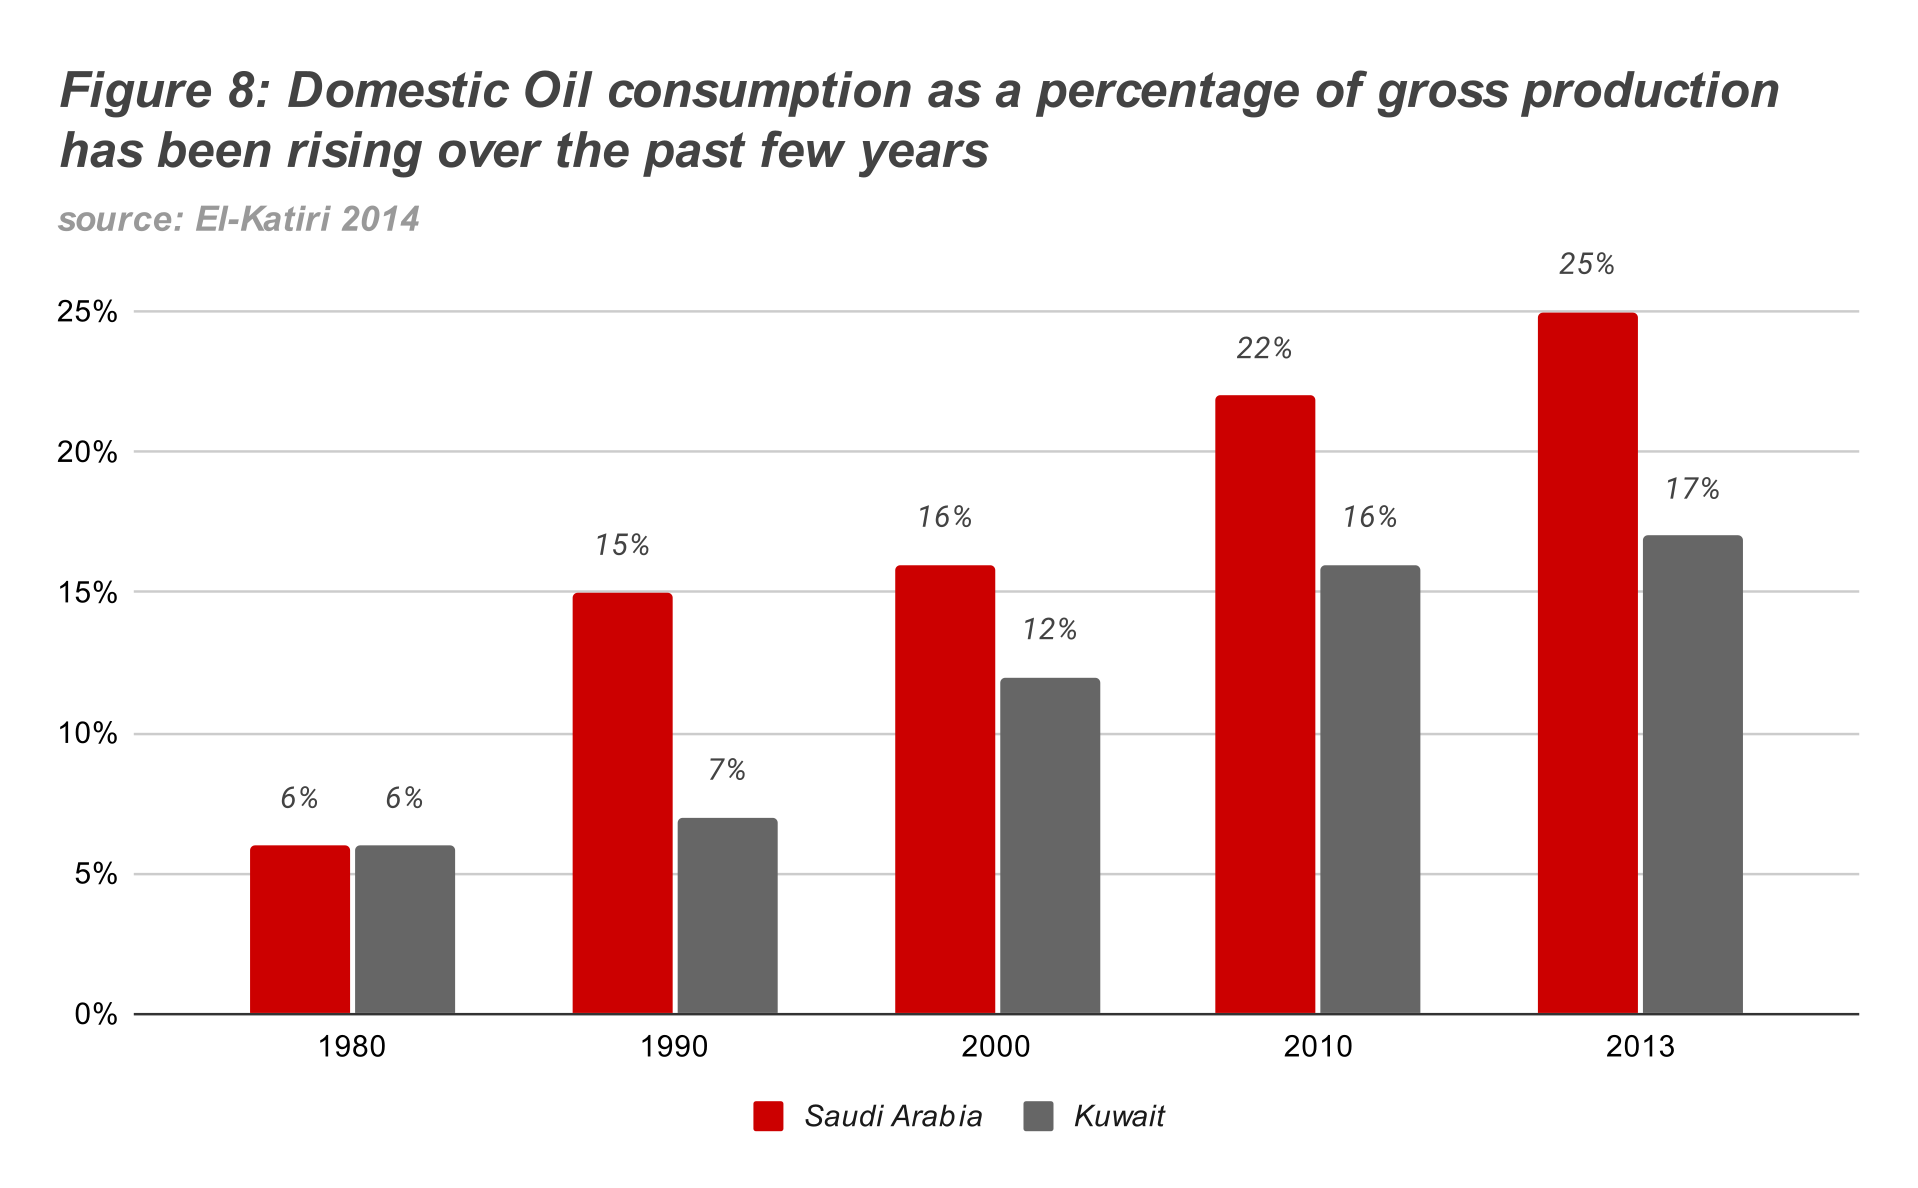
Looking at our second policy recommendation, it’s recommended to raise fuel prices and tax vehicles based on their fuel economy and emission rates. Past research outside the GCC has shown that raising fuel prices incentivizes consumers to utilize vehicles with greater fuel economy and switch towards an overall different form of energy, such as electric or hybrid vehicles, in the long-run (Leard Linn and Cleary, 2020). It is important to note that taxes on vehicle emissions should be tiered, where cars that emit more should impose more significant tax levels, while vehicles with certain low levels of emissions could altogether be omitted from a tax. This is important towards environmental factors and the availability of oil to be used for exports rather than domestic consumption. To the best of our knowledge no such information exists for Bahrain, in Saudi Arabia and Kuwait, domestic oil consumption as a percentage of gross market oil production has been increasing since the 1980s (El-Katiri, 2014):
Given these indications, further sources indicate that Bahrain is likely a net importer of natural gas, given that reports have indicated that Bahrain will become a net importer by 2018 (NEEAP, 2017). Overall, our second policy recommendations should look to continue raising fuel prices towards their level, which represents their social marginal benefits, and that vehicles should also have a tax that reflects their efficiencies so that consumers can transition towards more efficient forms of transportation. In addition, the funds raised by such taxation should be used for expanding public transit to maximize the effectiveness of the policy.
Conclusion
In conclusion, while motor vehicles produce substantial benefits in terms of personalized transportation and reduction in travel time, they also come with costs that are not factored into the price of such transportation methods. Evidence suggests that such costs are potentially significant towards society and that using taxation or raising fuel prices may be a long-term solution towards disincentivizing their usage (or transforming towards more efficient modes of their usage). Together with providing alternative transportation, this may lead towards an overall reduction in carbon emissions, smog, congestion, and potentially budget savings towards the government. Furthermore, taxation and raising fuel prices may reduce total externality costs and decrease in domestic fuel consumption, allowing to increase exports. Therefore, as per the findings of this article, we should gradually introduce a tax on motor vehicles while also raising fuel prices and continuing pushing the introduction of alternative transportation methods.

ABOUT THE AUTHOR

Appendix
Figure 1: Private Vehicles per 100 individuals rose from 18 to 34 over the past 36 years.
For our calculations, we use Total Private Vehicles from Central Informatics Organization, sourced from CEIC data (ceic, n.d), and population data from the World Bank (world bank, n.d). To calculate the total private vehicles per 100 individuals, we do the following:
Private Vehicles per 100 individuals =(Private Vehicles / Population) *100
Figure 2: Relationship between pirate cars per 100 individuals and average income.
The following figure shows a scatter plot of percentage change of GDP per capita (our variable to measure average income) and percentage change of vehicles per 100 individuals. This graph was controlled for outliers where outlier data points are replaced with either their upper or lower boundaries. Our GDP per capita data is sourced from the world bank (world bank, n.d.).
Figure 6: Cars per kilometer of Road network
This graph shows the number of cars per kilometer of road network. It is important to note that we use all vehicles registered, and not just private vehicles. Road network length is from Ministry of Works, sourced from CEIC data (ceic, n.d). The way which we have calculated our cars per kilometer is of road network follows as:
Cars per kilometer of road =total registered vehicles / total kilometer of road network
Figure 7: Percentage of transportation being mass transportation has been historically low
Our graph here shows the percentage of mass transportation as a percentage of total vehicle registrations in Bahrain. We define mass transportation as registered private buses, public buses, and government transportation. Our data is from from Central Informatics Organization, sourced from CEIC data (ceic, n.d). Our calculations simply follow as total mass transportation divided by total registered vehicles.